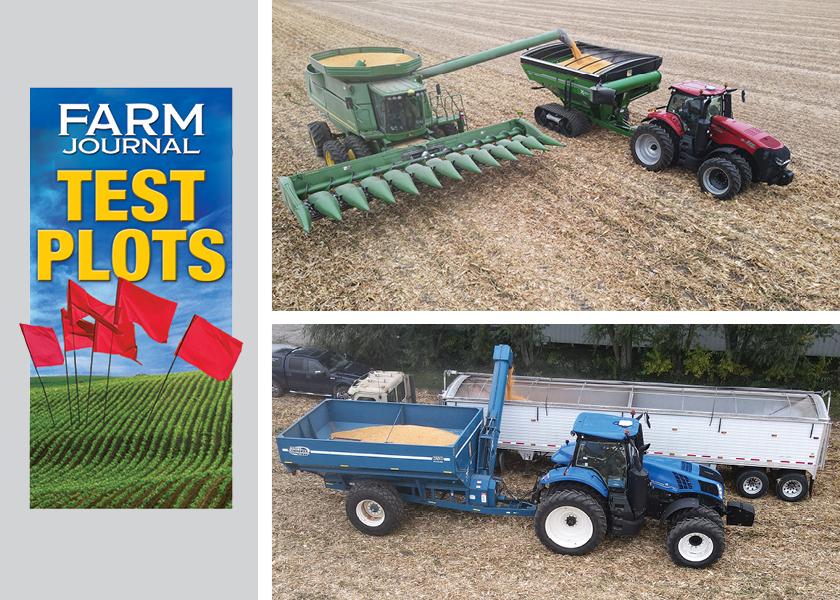
2022 Farm Journal Test Plots Early Results
Ken Ferrie and the Crop-Tech Consulting crew have been harvesting the Farm Journal Test Plots as well as their “teaching plots” the past few weeks. The full results of these plots will be shared in Farm Journal magazine, on AgWeb and at various events where Ken and Isaac Ferrie are scheduled to speak this winter and early spring.
Here is a summary of initial results.
Soybean Planting Date
In this plot, each maturity — 2.6, 3.4 and 4.6 — was planted on April 12, April 27 and May 12.
- 2.6 soybean results: Planting April 27 versus May 12 yielded a 2-bu. increase. Moving from April 27 to April 12 resulted in a 5-bu. increase.
- 3.4 soybean results: The plot showed an 8-bu. increase planting April 27 compared with May 12 but only a 1-bu. increase planting April 12 versus April 27.
- 4.6 soybean results: Yield increased 3 bu. moving from May 12 to April 27 and another 5 bu. moving to April 12 planting.
“It looks like there was a 7-bu. to a 9-bu. gain from planting on April 12 versus May 12,” Ferrie says. “This does surprise me a little bit on the basis it took forever for those April 27 and April 12 soybeans to get out of the ground.”
Read more: 8 Tips for Planting Soybeans Early
15” Versus 30” Rows
Ferrie also looked at the performance of bush beans compared to narrow-row soybeans. The bush beans were planted in six maturity groups from a 2.9 up to a 4.0 in both 15” rows and 30” rows.
“It looks like the narrow-row beans did respond to narrower rows by 3 bu. to 5 bu., meaning they were 3 bu. to 5 bu. better in 15s than they were in 30s,” he says. “It looks like the bush beans had no response to row spacing, which is also kind of interesting.”
Sulfur Products and Application Timing
In this plot, Ferrie evaluated a variety of sulfur products and various application timings and their impact on soybeans. Overall, he saw a positive yield response of between 2 bu. and 5 bu. in the plot.
“The data in these Farm Journal campus plots is not well replicated, but it will be presented this winter at our virtual Corn & Soybean College on Jan. 5, 2023, as a lot of you want to know how those plots do,” he says.
Corn Planter Fertility
Based on his initial findings, Ferrie says there is a yield difference between fertility applications in these plots but not as significant as what he saw in 2021.
His takeaway: “When corn comes out of the ground in four to five days, it probably doesn’t need as much help as we typically would expect. There are responses, but they are smaller,” he says.
Corn Fungicide Plot
In Ferrie’s area around Heyworth, Ill., fungicide plots are not showing a lot of response because disease pressure was less severe this season than 2021. He expects to see more response in plots where more disease pressure was present.
However, Ferrie notes excellent yield results in one fungicide plot where the weather was ideal this season.
“With 15 entries, the plot averaged over 300 bu. per acre. Matter of fact, only one entry went under 300 bu.,” he says. “Dryland plots like that are far and few between.”
Teaching Plots
Ferrie’s team has harvested all the corn teaching plots planted at their facility near Heyworth, Ill. They pulled more than 100 test-weight samples from the small plots which have little replication.
“We’ll put the data from our teaching plots in the virtual Corn & Soybean College on Jan. 5,” he says. “These plots are only teaching plots, but attendees always want to know how the plots did that they visited during the summer. So, we’ll add that into our virtual event this winter.”
Here’s a brief look at results from four teaching plots.
1. Of the four different starter plots this season, Ferrie and team saw a 19-bu. to 21-bu. increase. “That was surprising because this corn came up in five days,” he says. “I don’t expect those gains to hold when we get out into our field-scale plots planted outside of campus.”
2. Sulfur timing and product plots showed a gain of about 7 bu. to 12 bu., depending on the product.
3. Results from the one-and-done teaching plots were surprising.
“Where we put all the nitrogen (N) on in one shot and put it up against what we call the full-meal deal — where we break that same N rate across different timings – the one shot showed a 10-bu. to 12-bu. advantage over breaking the N rates up,” he says. “This is kind of surprising being it was an N-friendly year.”
4. In the small fixed-flex plots, Ferrie’s team planted hybrids at 22,000 (population) and again at 36,000 to measure how much hybrids flexed between those populations.
“In our 22,000 side of the plot the (yield) range was from 180 bu. to 233 bu.; on the 36,000-side of the plot, yield swung from 242 bu. to 307 bu.,” he says. “It seems crazy some hybrids can reach 233 bu. on a planted population of 22,000.”
Full-Scale Fixed Flex
Ferrie and team did harvest one full-scale fixed flex corn plot, which had 16 hybrids. The 22,000 side of the plot went from 198 bu. per acre to 250 bu., with an average of 227 bu., he reports. The 36,000-population side of the plot went from 252 bu. to 285 bu., with an average of 272 bu. per acre.
“Ear samples are taken from these plots for our hand harvest this fall,” Ferrie says. “That’s where we’ll identify where this flex is coming from. The information from these plots is helping to move the needle quite a bit for our multi-hybrid guys.”
Thank You to Our Plot Partners The Farm Journal Test Plots are possible thanks to the contributions of many people and companies: AgReliant Genetics/AgriGold, BASF, Bayer, Wyffels Hybrids, Case IH, Great Plains Manufacturing, Kinze Manufacturing, Martin-Till, New Holland Agriculture, Precision Planting, Schaffert Manufacturing, Unverferth Manufacturing, Yetter Farm Equipment, Yield 360, Crop-Tech Consulting and B&M Crop Consulting