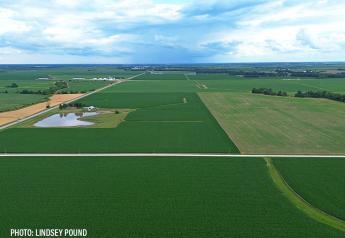
9 Ag Statistics to Know in 2019
USDA looked into its crystal ball this week and released its first round of numbers for many key forecasts for agriculture in 2019 and beyond.
“Increasing productivity at home and growing export markets is what we expect over the next 10 years,” says USDA Chief Economist Robert Johansson. “A lot could affect our ability to meet or exceed those expectations: public spending on agricultural research and development has slowed, trade agreements and disputes between us and our trading partners may help or hinder export potential, and as we’ve seen the past two years, disastrous weather here or in other major producing regions can impact global supplies.”
USDA’s general expectation is for continued declines in real agricultural commodity prices over the next 10 years, Johansson says. “Falling commodity prices are the result of continued production growth, which continues to outpace global demand.”
Johansson speaking at USDA’s 2019 Agricultural Outlook Forum in Arlington, Va., shared these facts and figures, which are good to keep in mind as you finalize your plans for 2019.
10%: The decrease in the share of people who are food insecure globally. This metric is expected to fall from more than 20% of the world’s population in 2018 to about 10% in 2028, despite a much larger global population.
$80 billion: The average net farm income forecast for the next decade. For 2018, net farm income was $66 billion, which is dramatically lower than when real net farm income peaked at $134 billion in 2013.
1-in-10: Crop businesses that are in a highly leveraged situation (defined as debt-to-asset ratios of higher than 0.40).
2.35: Today’s number of bankruptcies per 10,000 farms, which is lower than the 3 bankruptcies seen in the 2010-2012 period.
90%: The amount soybean exports to China have plummeted under the trade dispute. This drop equals 22 million metric tons.
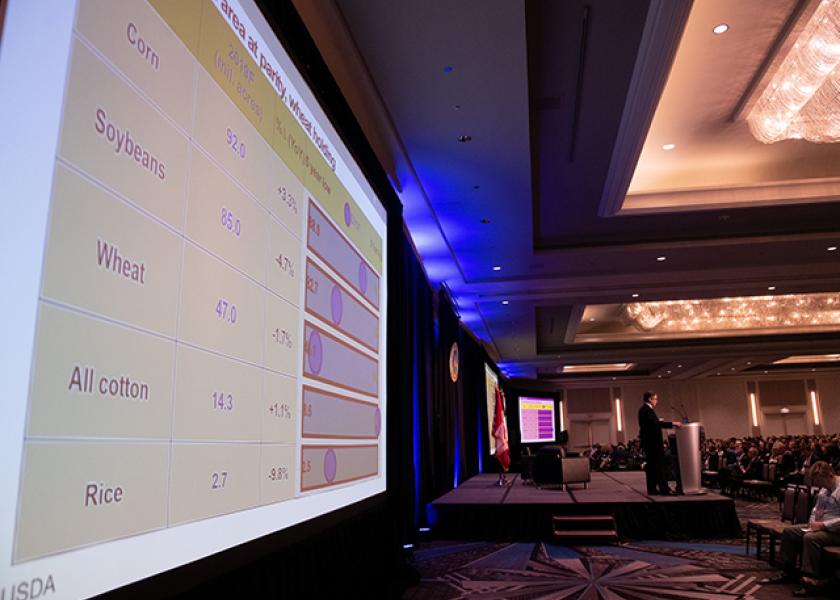
47 million acres: All wheat acres in 2019. Winter wheat acres will be the lowest in 110 years.
$141.5 billion: The value of U.S. agricultural exports in fiscal 2019, down $1.9 billion from 2018.
5th: China’s rank in 2019 for the share of total U.S. agricultural exports. In 2017, China was the top market.
1/3: In 2018, the U.S. produced the most corn and soybeans in the world, representing slightly more than 30% of total global production.
Read more coverage from USDA’s 2019 Agricultural Outlook Forum:
USDA: Corn to Be King Again in 2019
Ag Leaders Offer Limited Answers with USMCA Tariff Timeline
USDA: Soybean Plantings Will Decline, Corn Will Rise in 2019